## 编译环境
操作系统
* [10] Windows 7/8/10
* [ ] macOS
* [ ] Linux
`若需勾选,请把[ ]改成[x]`
Tex发行版
* [2019] TexLiv...
## 编译环境
操作系统
* [10] Windows 7/8/10
* [ ] macOS
* [ ] Linux
`若需勾选,请把[ ]改成[x]`
Tex发行版
* [2019] TexLive `年份`
* [ ] MikTeX `版本号`
* [ ] CTeX
`若需勾选,请把[ ]改成[x]`
## 我的问题
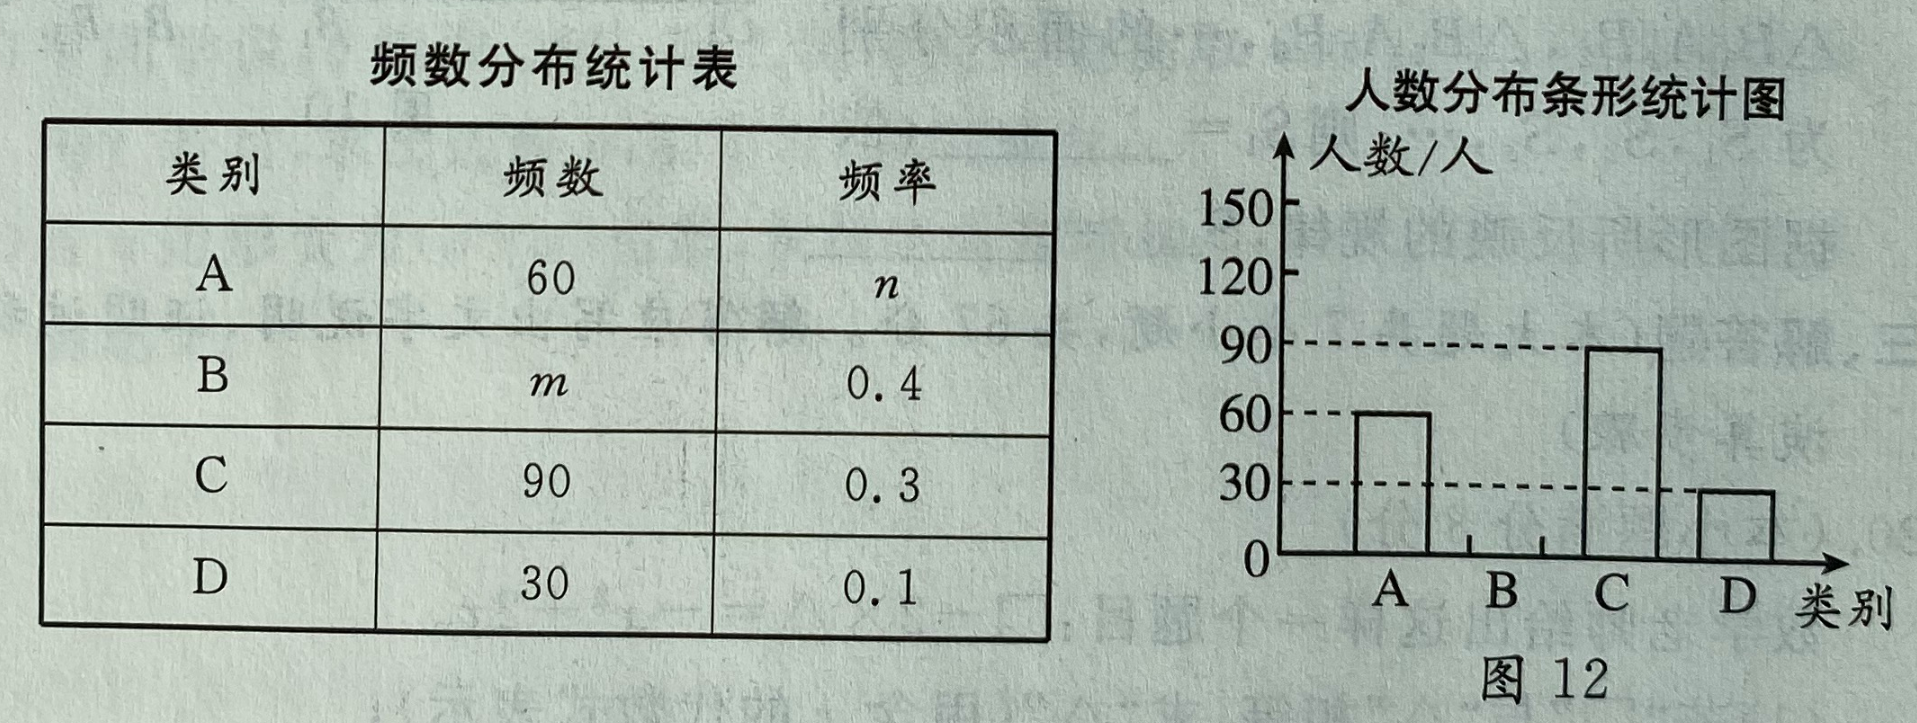
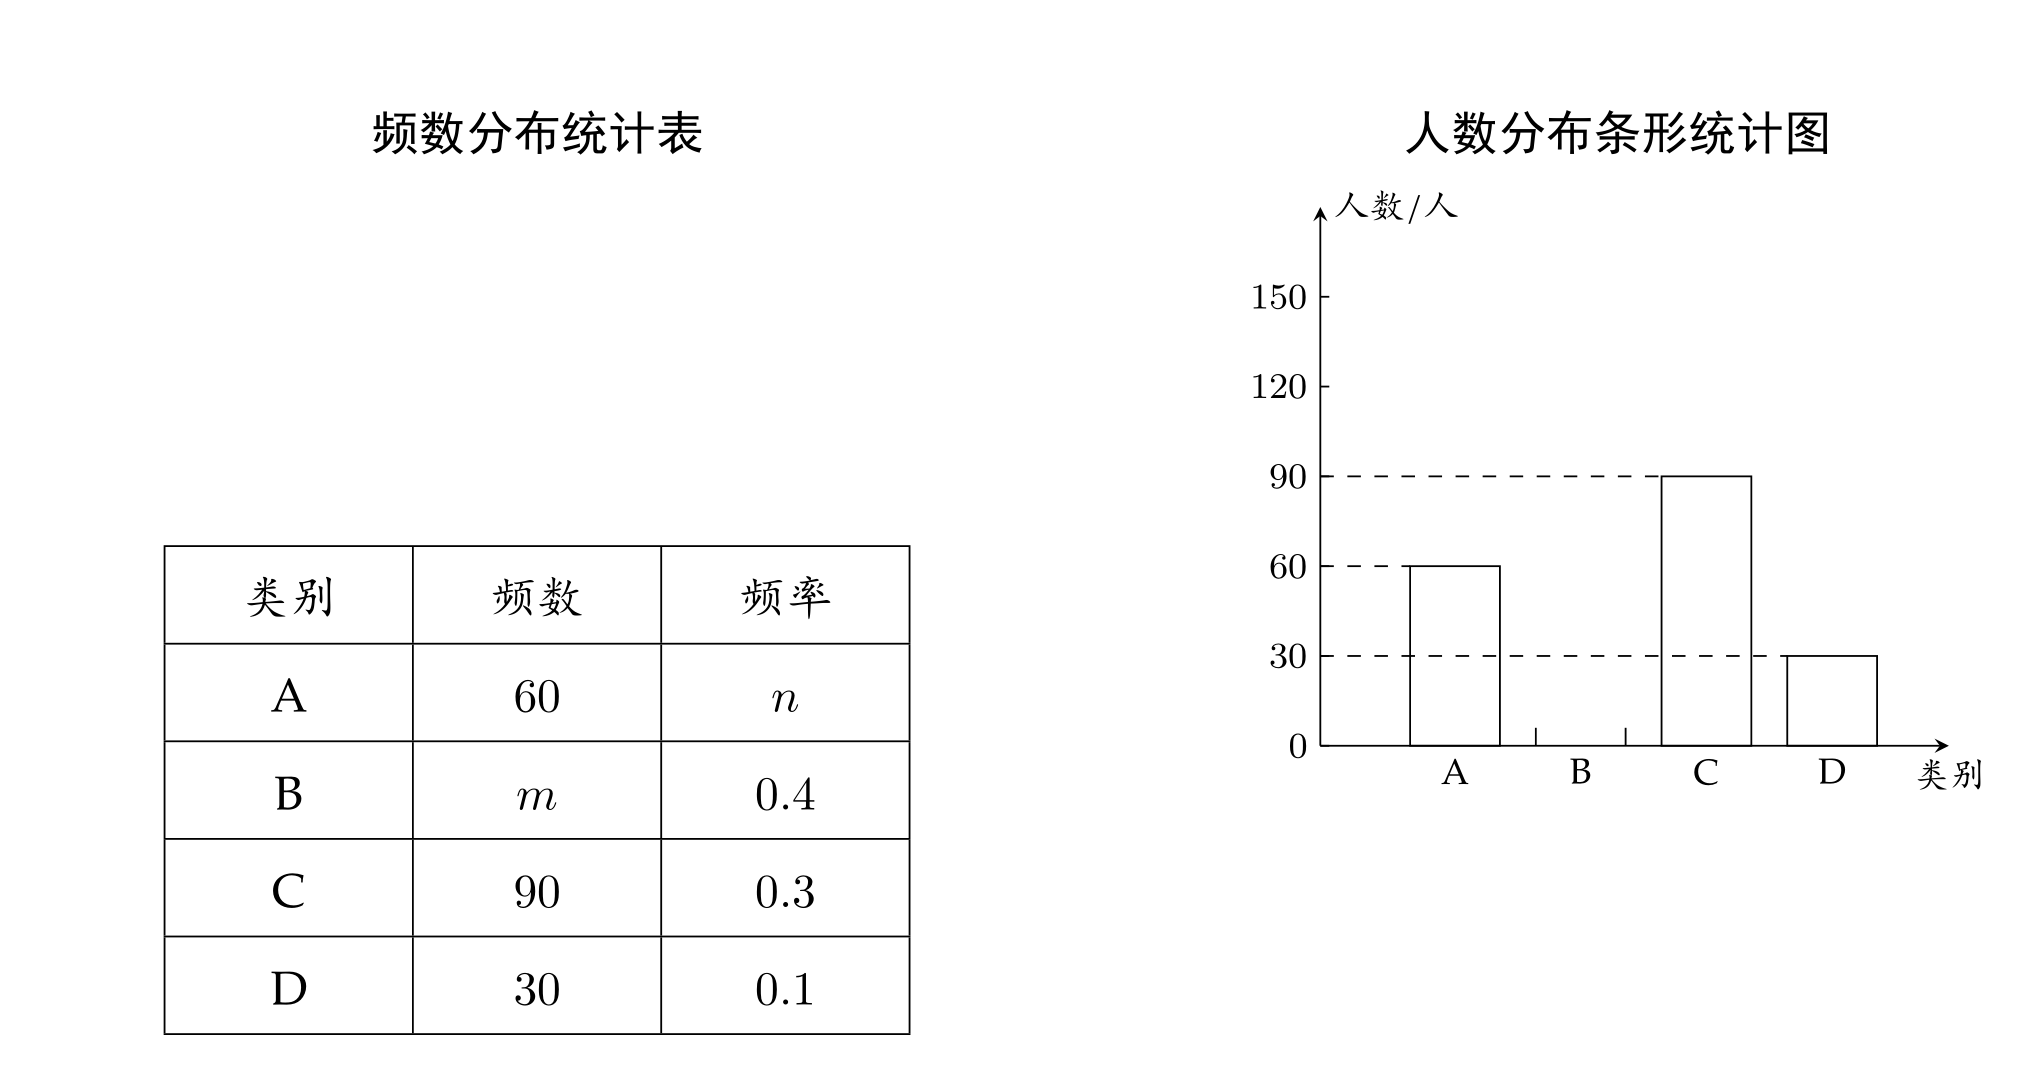
在此输入你遇到的问题...我画一个表格和一个图,想的是把他们画到大表格中,但是小表格和图不对齐,想请教一下应该如何解决
我需要的效果是这样
但是实际的效果是这样
我的代码如下:
```
\begin{center}
\begin{tabular}{p{8cm}<{\centering}p{8cm}<{\centering}}
{\heiti 频数分布统计表} & {\heiti 人数分布条形统计图}\\
\begin{tabular}{|p{1.5cm}<{\centering}|p{1.5cm}<{\centering}|p{1.5cm}<{\centering}|}
\hline
{\kaishu 类别} &{\kaishu 频数} &{\kaishu 频率}\\
\hline
A & $60$ & $n$\\
\hline
B & $m$ & $0.4$\\
\hline
C & $90$ & $0.3$\\
\hline
D & $30$ & $0.1$\\
\hline
\end{tabular} &
\begin{tikzpicture}[ scale=.7]
\begin{scriptsize}
\draw [-stealth] (0,0)--(7,0) node [below] {{\kaishu 类别}};
\draw [-stealth] (0,0) --(0,6) node [right] {{\kaishu 人数/人}};
\foreach \i in {0,30,60,90,120,150}
{
\draw (0,{\i/30}) node [left] {$\i$}--(0.1,{\i/30});
}
\draw (1,0) rectangle (2,2);
\draw (3.8,0) rectangle (4.8,3);
\draw (5.2,0) rectangle (6.2,1);
\draw [dashed] (0,3)--(3.8,3)(0,2)--(1,2)(0,1)--(5.2,1);
\draw (2.4,0)--(2.4,0.2)(3.4,0)--(3.4,0.2);
\node [below] at (1.5,0) {A};
\node [below] at (2.9,0) {B};
\node [below] at (4.3,0) {C};
\node [below] at (5.7,0) {D};
\end{scriptsize}
\end{tikzpicture}\\
\end{tabular}
\end{center}
```
谢谢大家
一周热门 更多>