提问于:
浏览数:
4915
](https://wenda.latexstudio.net/data/attach/191011/hc2hVcrx.png)

3 回答
0
我很建议你给代码而不是这样给截图。
回答: 2019-10-11 21:17
处理子图有挺多方法的,用不着非拿 minipage 来用。

-
代码我附在楼下了 – docxwq94 2019-10-11 21:09 回复
-
\begin{figure} \begin{minipage}[t]{0.35\linewidth} \centering \includegraphics[height=4.5cm,width – docxwq94 2019-10-11 21:08 回复
0
```tex
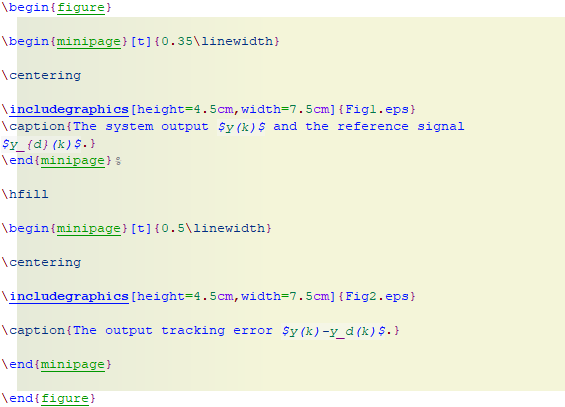
\begin{figure}
\begin{minipage}[t]{0.35\linewidth}
\centering
\includegraphics[height=4.5cm,width=7.5cm]{Fig1.eps}
\caption{The system output $y(k)$ and the reference signal
$y_{d}(k)$.}
\end{minipage}%
\hfill
\begin{minipage}[t]{0.5\linewidth}
\centering
\includegraphics[height=4.5cm,width=7.5cm]{Fig2.eps}
\caption{The output tracking error $y(k)-y_d(k)$.}
\end{minipage}
\end{figure}
\begin{figure}
\begin{minipage}[t]{0.35\linewidth}
\centering
\includegraphics[height=4.5cm,width=7.5cm]{Fig3.eps}
\caption{The input signal $w(k)$.}
\end{minipage}%
\hfill
\begin{minipage}[t]{0.5\linewidth}
\centering
\includegraphics[height=4.5cm,width=7.5cm]{Fig4.eps}
\caption{The norm of the weight vectors $\|\hat{\varpi}\left(
k\right)\| $ and $\|\hat{\varpi}_{c}\left( k\right)\| $.}
\end{minipage}
\end{figure}
\begin{figure}
\begin{minipage}[t]{0.35\linewidth}
\centering
\includegraphics[height=4.5cm,width=7.5cm]{Fig5.eps}
\caption{Threshold and event-triggered error.}
\end{minipage}%
\hfill
\begin{minipage}[t]{0.5\linewidth}
\centering
\includegraphics[height=4.5cm,width=7.5cm]{Fig6.eps}
\caption{The
accumulative number of the event-triggered events.}
\end{minipage}
\end{figure}
```

你的回答
请登录后回答
你的回答将会帮助更多人,请务必认真回答问题。