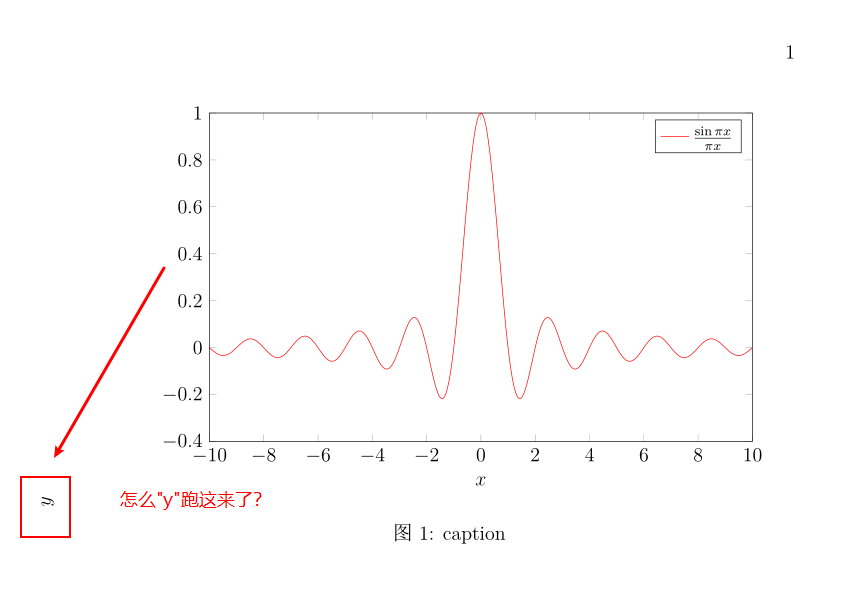
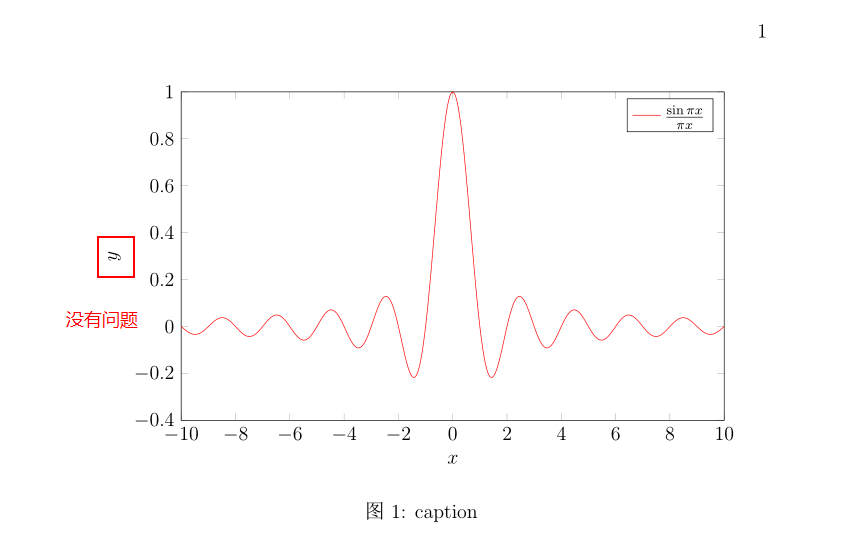
[图]用pgfplots画了一个函数图,在xelatex编译下,no errors ,no warnings。但是 y轴标题飞了,结果如图用pdflatex编译却没有问题,结果如图代码如下%!TEX pro...
用pgfplots画了一个函数图,在xelatex编译下,no errors ,no warnings。但是 y轴标题飞了,结果如图

用pdflatex编译却没有问题,结果如图

代码如下
%!TEX program = xelatex
% 使用 ctexart 文类,UTF-8 编码
%!TEX spellcheck
\documentclass[UTF8,a4paper,12pt]{ctexart}
\usepackage[left=3.18cm,right=3.18cm,top=2.54cm,bottom=2.54cm]{geometry}%页面设置
\usepackage{graphicx}
\usepackage{pgf,tikz,pgfplots}
\pgfplotsset{compat=1.16}
\usepackage{mathrsfs}
\usetikzlibrary{arrows}
\begin{document}
 \begin{figure}[htbp]
  \centering
  \begin{tikzpicture}
  \begin{axis}[
  width=4.525in,
  height=2.737in,
  scale only axis,%整个轴的范围,而不是图的范围
  xmin=-10,,xmax=10,
  ymin=-0.4,ymax=1,
  xlabel={$x$},ylabel={$y$},
  xtick={-10,-8,...,10},
  % xticklabels={1,2,...,10,$\pi$},%在相应刻度写表达式
  ytick={-0.4,-0.2,...,1},
  % yticklabel={};
  ]
  \addplot [
  smooth,
  red,
  domain=-10.0:10.0,
  samples=2001,
  ]
  {sin(pi*(x)*180/pi)/(pi*(x))};
  \addlegendentry{$\frac{\sin \pi x}{\pi x}$};
  \end{axis}
  \end{tikzpicture}
  \caption{caption}
  \label{fig:label}
 \end{figure}
 % \begin{figure}[htbp]
 %  \centering
 %  \input{pgfplots2}
 % \end{figure}
\end{document}
怎么回事啊?
编译两次看看,版本推荐新一点的版本。
一周热门 更多>