试了很多种方法,但是图片排版仍然有点问题,请大佬们帮忙看看:
目标打算排版成这样:

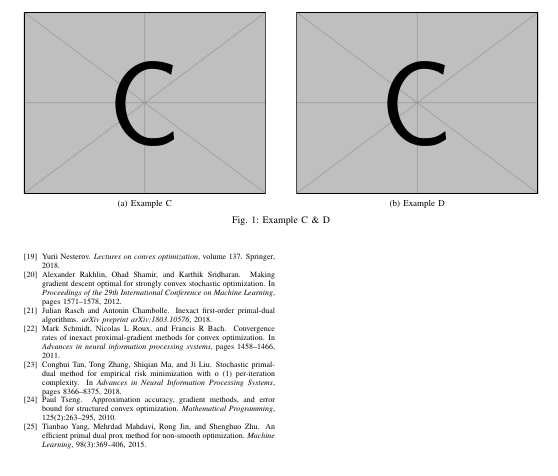
现在排版成这样:
相关部分代码:
\documentclass[journal]{IEEEtran}
\usepackage{amssymb}
\usepackage{enumerate}
\usepackage{graphicx}
\usepackage{epstopdf}
\usepackage{subfigure}
\usepackage[centerlast]{caption}
\usepackage{color}
\usepackage{amsfonts}
\usepackage{varwidth}
%\usepackage{autobreak}
\newtheorem{theorem}{Theorem}[section]
\newtheorem{lemma}{Lemma}
\newtheorem{proof}{Proof}[section]
\begin{document}
\begin{figure}
%\vskip 0.2in
\centering
\begin{varwidth}[t]{\textwidth}
\vspace{0pt}
\includegraphics[height=2cm, width=3cm]{3-astro-tau30-4.eps}
\end{varwidth}
\qquad
\begin{varwidth}[t]{\textwidth}
\vspace{0pt}
\includegraphics[height=2cm, width=3cm]{1-cov-tau5-4.eps}
\end{varwidth}
\vskip -0.2in
\end{figure}
\begin{figure}
%\vskip 0.2in
\centering
\begin{varwidth}[ht]{\textwidth}
\vspace{0pt}
\includegraphics[height=4cm, width=5cm]{1-ijcnn1-tau5-4.eps}
\end{varwidth}
\qquad
\begin{varwidth}[ht]{\textwidth}
\vspace{0pt}
\includegraphics[height=4cm, width=5cm]{1-rcv1-tau23-4.eps}
\end{varwidth}
\caption{ Convergence on the data-set a9a}
\vskip -0.2in
\end{figure}
\end{document}
感谢三位大佬的回答,前两位大佬的我试了可能会插图到文末,导致变成这种情况:

我想插图插在文章中间部分,不知道怎么实现,谢谢
一周热门 更多>