## 编译环境
操作系统
* [ ] Windows 7/8/10
* [ ] macOS
* [x] Linux
`若需勾选,请把[ ]改成[x]`
Tex发行版
* [x] TexLive `年...
## 编译环境
操作系统
* [ ] Windows 7/8/10
* [ ] macOS
* [x] Linux
`若需勾选,请把[ ]改成[x]`
Tex发行版
* [x] TexLive `年份`
* [ ] MikTeX `版本号`
* [ ] CTeX
`若需勾选,请把[ ]改成[x]`
## 我的问题
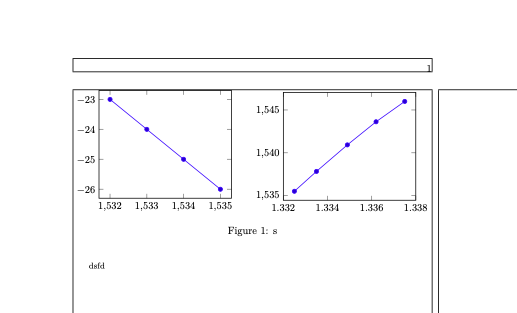
这是我现在得到的图片:

可以看出来右图要低一点,我发现可能是由于左图横坐标数值有逗号导致的,所以我把子图对齐的选项改为“t“,但是无效。求大佬帮忙看看。
这是我的代码:
```
\documentclass{book}
\usepackage{pgfplots}
\pgfplotsset{compat=1.17}
\usepackage{caption}
\usepackage{subcaption}
\usepackage{showframe}
\begin{document}
\begin{figure}
\centering
\begin{subfigure}[t]{0.5\linewidth}
\pgfplotstableread{
x y
1532 -23
1533 -24
1534 -25
1535 -26
}{\datatable}
\pgfplotsset{width=\linewidth}
\begin{tikzpicture}
\begin{axis}[]
\addplot+ [] table []{\datatable};
\end{axis}
\end{tikzpicture}
\end{subfigure}%
\begin{subfigure}[t]{0.5\linewidth}
\pgfplotstableread{
x y
1.3325 1535.5
1.3335 1537.82
1.3349 1540.92
1.3362 1543.62
1.3375 1546
}{\datatable}
\pgfplotsset{width=\linewidth}
\begin{tikzpicture}
\begin{axis}[
x tick label style={
/pgf/number format/.cd,
precision=4,
/tikz/.cd
}
]
\addplot+ [] table [] {\datatable};
\end{axis}
\end{tikzpicture}
\end{subfigure}%
\caption{s}
\label{fig:s}
\end{figure}
dsfd
\end{document}
```
一周热门 更多>