## 编译环境
操作系统
* [10 ] Windows 7/8/10
* [ ] macOS
* [ ] Linux
`若需勾选,请把[ ]改成[x]`
Tex发行版
* [2020 ] TexL...
## 编译环境
操作系统
* [10 ] Windows 7/8/10
* [ ] macOS
* [ ] Linux
`若需勾选,请把[ ]改成[x]`
Tex发行版
* [2020 ] TexLive `年份`
* [ ] MikTeX `版本号`
* [ ] CTeX
`若需勾选,请把[ ]改成[x]`
## 我的问题
如题,用GeoGebra进行绘图时,生成代码
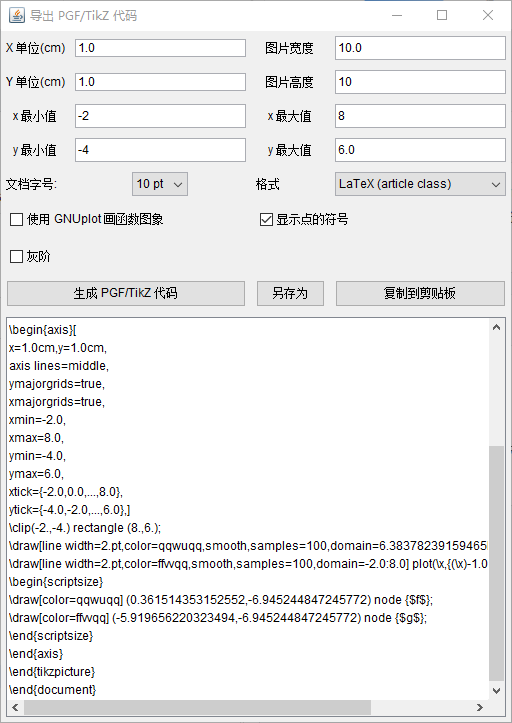
编译时出现错误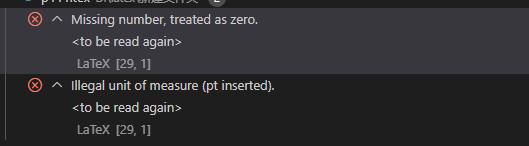
附MWE:
```
\documentclass[10pt]{article}
\usepackage{pgfplots}
\pgfplotsset{compat=1.15}
\usepackage{mathrsfs}
\usetikzlibrary{arrows}
\pagestyle{empty}
\begin{document}
\definecolor{ffvvqq}{rgb}{1.,0.3333333333333333,0.}
\definecolor{qqwuqq}{rgb}{0.,0.39215686274509803,0.}
\begin{tikzpicture}[line cap=round,line join=round,>=triangle 45,x=1.0cm,y=1.0cm]
\begin{axis}[
x=1.0cm,y=1.0cm,
axis lines=middle,
ymajorgrids=true,
xmajorgrids=true,
xmin=-2.0,
xmax=8.0,
ymin=-4.0,
ymax=6.0,
xtick={-2.0,0.0,...,8.0},
ytick={-4.0,-2.0,...,6.0},]
\clip(-2.,-4.) rectangle (8.,6.);
\draw[line width=2.pt,color=qqwuqq,smooth,samples=100,domain=6.38378239159465E-16:8.0] plot(\x,{ln((\x))});
\draw[line width=2.pt,color=ffvvqq,smooth,samples=100,domain=-2.0:8.0] plot(\x,{(\x)-1.0});
\begin{scriptsize}
\draw[color=qqwuqq] (0.361514353152552,-6.945244847245772) node {$f$};
\draw[color=ffvvqq] (-5.919656220323494,-6.945244847245772) node {$g$};
\end{scriptsize}
\end{axis}
\end{tikzpicture}
\end{document}
```
{var%20f='http://v.t.sina.com.cn/share/share.php?appkey=1515056452',u=z||d.location,p=['&url=',e(u),'&title=',e(t||d.title),'&source=',e(r),'&sourceUrl=',e(l),'&content=',c||'gb2312','&pic=',e(p||'')].join('');function%20a(){if(!window.open([f,p].join(''),'mb',['toolbar=0,status=0,resizable=1,width=440,height=430,left=',(s.width-440)/2,',top=',(s.height-430)/2].join('')))u.href=[f,p].join('');};if(/Firefox/.test(navigator.userAgent))setTimeout(a,0);else%20a();})(screen,document,encodeURIComponent,'','','https://wenda.latexstudio.net/data/attach/logo/logo.png', '推荐 玄空出世 的问题《用GeoGebra进行绘图导出的TikZ代码编译出现问题Missing number, treated as zero. <to> 错误》','https://wenda.latexstudio.net/answer/5439/4486.html','页面编码gb2312|utf-8默认gb2312'));)
一周热门 更多>