提问于:
浏览数:
3906

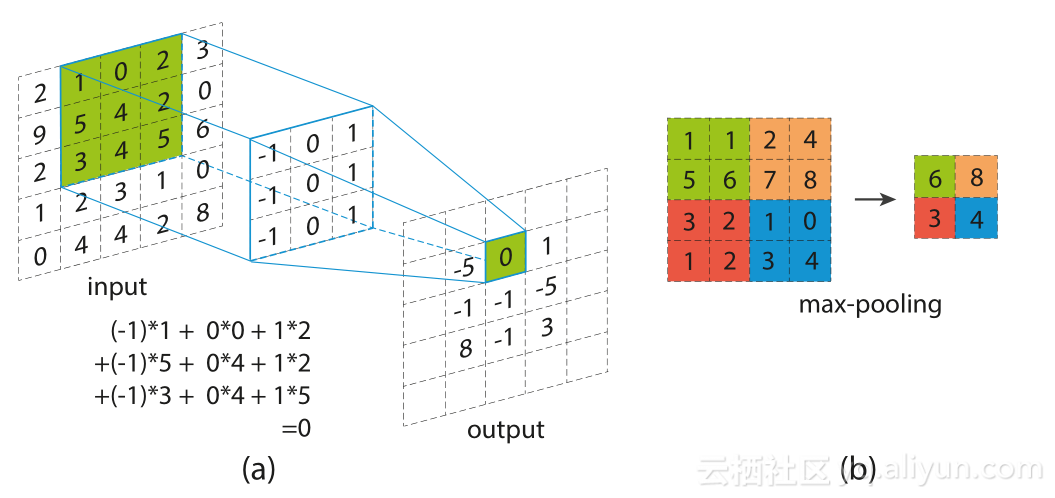
这样的图片用tikz怎么画呢,能提示一下吗
3 回答
3
画法可以参照我上传的示例[tikz描绘三维层次图](https://www.latexstudio.net/index/details/index/ids/266 "tikz描绘三维层次图")。
3 维立体图主要用到技术是图形的切变,对应选项是`xslant`,`yslant`或更通用的`cm`。大致思路是,先在一个`scope`中画好平面化的图(a),填好数字,设置好你需要的锚点。如下图。

然后将整个`scope`进行切变。其中切变矩阵需要自己人手计算(需要扎实的线性代数基础,或者试错法一点一点调)。如下图。

将3个`scope`切变好后,就可以在外部将锚点连起来了。

1
<p>比较复杂,你这个还需要填数字,如果不需要数字的话,可以去看看我的包,在github上ZhiyuanLck/dnnplot,不过写完了一直没维护,你可以试一下能不能运行吧,如果有报错的话那我暂时也没办法,只能推荐其他软件,visio或者ai</p>
1
提供另一种思路:使用三维坐标,自定义坐标轴的夹角,每次在特定平面里绘图。
```tex
\documentclass{article}
\usepackage{tikz}
\usetikzlibrary {3d}
\begin{document}
\begin{tikzpicture}[x={(10:10mm)}, z={(-30:10mm)}]
\begin{scope}[->, above]
\draw (0, 0) -- +(3, 0) node {x};
\draw (0, 0) -- +(0, 3) node {y};
\draw (0, 0, 0) -- +(0, 0, 3) node {z};
\end{scope}
\foreach \i in {1, ..., 5} {
\foreach \j in {1, ..., 5} {
\draw (\i, \j) -- ++(1, 0) -- ++(0, 1) -- ++(-1, 0) -- cycle;
}
}
\begin{scope}[canvas is xy plane at z=5]
\foreach \i in {2, ..., 4} {
\foreach \j in {2, ..., 4} {
\draw (\i, \j) -- ++(1, 0) -- ++(0, 1) -- ++(-1, 0) -- cycle;
}
}
\end{scope}
\begin{scope}[canvas is xy plane at z=10]
\foreach \i in {1, ..., 5} {
\foreach \j in {1, ..., 5} {
\draw (\i, \j) -- ++(1, 0) -- ++(0, 1) -- ++(-1, 0) -- cycle;
\node[font=\sffamily, transform shape] at (\i+.5, \j+.5) {\i, \j};
}
}
\end{scope}
\end{tikzpicture}
\end{document}
```

你的回答
请登录后回答
你的回答将会帮助更多人,请务必认真回答问题。
