提问于:
浏览数:
2606
## 编译环境
操作系统
* [x] Windows 7/8/10
* [ ] macOS
* [ ] Linux
`若需勾选,请把[ ]改成[x]`
Tex发行版
* [x] TexLive `2019`
* [ ] MikTeX `版本号`
* [ ] CTeX
`若需勾选,请把[ ]改成[x]`
## 我的问题
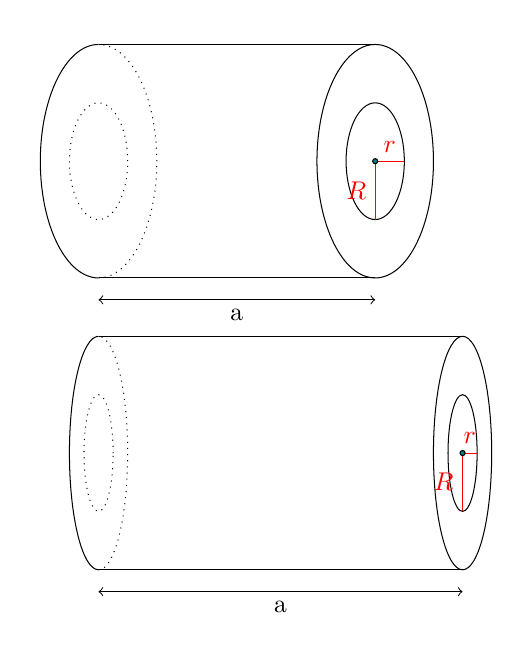
用tikz绘图,指定参数值,只能生成部分图形,全部改成数值后,可以生成正确图形。请指点。
```markdown
\begin{tikzpicture}
\def\ra{0.4} %利用参数定义小,大椭圆,长度。
\def\rb{0.8}
\def\Ra{0.8}
\def\Rb{1.6}
\def\a{3.8}
\draw[dotted] (0,0) ellipse (\ra and \rb);
\draw (0,\Rb) arc (90: 270: \Ra and \Rb);
\draw [dotted](0,-\Rb) arc (-90: 90: \Ra and \Rb);
\draw (3.8,0) ellipse (0.4 and 0.8);
\draw (3.8,0) ellipse (0.8 and 1.6);
\draw (0,\Rb) -- (\a,\Rb);
\draw (0,-\Rb) -- (\a,-\Rb);
\draw [<->](0,-\Rb-0.3) -- node[below] {a}(\a,-\Rb-0.3);
\draw [red](\a,0) --node[above] {$r$} (\a+\ra,0);
\draw [red](\a,0) --node[left] {$R$} (\a,-\rb);
\filldraw[fill=teal,draw=black] (\a,0) circle (1pt);
\end{tikzpicture}
```
```markdown
\begin{tikzpicture}
\draw[dotted] (0,0) ellipse (0.4 and 0.8);
\draw (0,1.6) arc (90: 270: 0.8 and 1.6);
\draw [dotted](0,-1.6) arc (-90: 90: 0.8 and 1.6);
\draw (3.8,0) ellipse (0.4 and 0.8);
\draw (3.8,0) ellipse (0.8 and 1.6);
\draw (0,1.6) -- (3.8,1.6);
\draw (0,-1.6) -- (3.8,-1.6);
\draw [<->](0,-1.6-0.3) -- node[below] {a}(3.8,-1.6-0.3);
\draw [red](3.8,0) --node[above] {$r$} (3.8+0.4,0);
\draw [red](3.8,0) --node[left] {$R$} (3.8,-0.8);
\filldraw[fill=teal,draw=black] (3.8,0) circle (1pt);
\end{tikzpicture}
```
3 回答
0
用tikz画图就用tikz的方式来画图,你的需求大概是自定义一个图形,然后可以通过改变参数来改变图形,再tikz里可以把图形存储在pic中,然后通过修改键值的方式来完成,下面给了一个示例,需要更多参数仿照这个写就行了。
```tex
\documentclass[tikz, border=1cm]{standalone}
\makeatletter
\tikzset{
test inner x/.store in=\test@inner@x,
test inner x=0.4,
test inner y/.store in=\test@inner@y,
test inner y=0.8,
test outer x/.store in=\test@outer@x,
test outer x=0.8,
test outer y/.store in=\test@outer@y,
test outer y=1.6,
test width/.store in=\test@width,
test width=3.8,
test/.pic = {
\draw[dotted] (0,0) ellipse ({\test@inner@x} and \test@inner@y);
\draw (0,\test@outer@y) arc (90: 270: {\test@outer@x} and \test@outer@y);
\draw [dotted](0,-\test@outer@y) arc (-90: 90: {\test@outer@x} and \test@outer@y);
\draw (\test@width,0) ellipse ({\test@inner@x} and \test@inner@y);
\draw (\test@width,0) ellipse ({\test@outer@x} and \test@outer@y);
\draw (0,\test@outer@y) -- (\test@width,\test@outer@y);
\draw (0,-\test@outer@y) -- (\test@width,-\test@outer@y);
\draw [<->](0,-\test@outer@y-0.3) -- node[midway, below] {a}(\test@width,-\test@outer@y-0.3);
\draw [red](\test@width,0) --node[midway, above] {$r$} (\test@width+\test@inner@x,0);
\draw [red](\test@width,0) --node[midway, left] {$R$} (\test@width,-\test@inner@y);
\filldraw[fill=teal,draw=black] (\test@width,0) circle (1pt);
}
}
\makeatother
\begin{document}
\begin{tikzpicture}
\pic at (0, 0) {test};
\pic[
test inner x = .2,
test outer x = .4,
test width = 5,
] at (0, -4) {test};
\end{tikzpicture}
\end{document}
```

-
非常感谢! – 海波 2020-12-13 20:34 回复
0
用大括号把 `and` 两边的命令括起来
```tex
\documentclass[tikz]{standalone}
\begin{document}
\begin{tikzpicture}
\def\ra{0.4} %利用参数定义小,大椭圆,长度。
\def\rb{0.8}
\def\Ra{0.8}
\def\Rb{1.6}
\def\a{3.8}
\draw[dotted] (0,0) ellipse ({\ra} and {\rb});
\draw (0,\Rb) arc (90: 270: {\Ra} and {\Rb});
\draw [dotted](0,-\Rb) arc (-90: 90: {\Ra} and {\Rb});
\draw (3.8,0) ellipse (0.4 and 0.8);
\draw (3.8,0) ellipse (0.8 and 1.6);
\draw (0,\Rb) -- (\a,\Rb);
\draw (0,-\Rb) -- (\a,-\Rb);
\draw [<->](0,-\Rb-0.3) -- node[below] {a}(\a,-\Rb-0.3);
\draw [red](\a,0) --node[above] {$r$} (\a+\ra,0);
\draw [red](\a,0) --node[left] {$R$} (\a,-\rb);
\filldraw[fill=teal,draw=black] (\a,0) circle (1pt);
\end{tikzpicture}
\end{document}
```

0
多谢指点。利用第一个回答,修正的代码:
```markdown
\begin{tikzpicture}
\def\ra{0.4} %利用参数定义小,大椭圆,长度。
\def\rb{0.8}
\def\Ra{0.8}
\def\Rb{1.6}
\def\a{3.8}
\draw[dotted] (0,0) ellipse ({\ra} and {\rb});
\draw (0,\Rb) arc (90: 270: {\Ra} and {\Rb});
\draw [dotted](0,-\Rb) arc (-90: 90: {\Ra} and {\Rb});
\draw (\a,0) ellipse ({\ra} and {\rb});
\draw (\a,0) ellipse ({\Ra} and {\Rb});
\draw (0,\Rb) -- (\a,\Rb);
\draw (0,-\Rb) -- (\a,-\Rb);
\draw [<->](0,-\Rb-0.3) -- node[below] {a}(\a,-\Rb-0.3);
\draw [red](\a,0) --node[above] {$r$} (\a+\ra,0);
\draw [red](\a,0) --node[left] {$R$} (\a,-\Rb);
\filldraw[fill=teal,draw=black] (\a,0) circle (1pt);
\end{tikzpicture}
```
[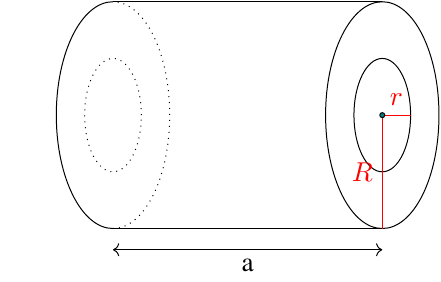](https://wenda.latexstudio.net/data/attach/200604/2uo7G4r5.png)
你的回答
请登录后回答
你的回答将会帮助更多人,请务必认真回答问题。