提问于:
浏览数:
1965
## 编译环境
操作系统
* [ x] Windows 7/8/10
* [ ] macOS
* [ ] Linux
`若需勾选,请把[ ]改成[x]`
Tex发行版
* [2019 ] TexLive `年份`
* [ ] MikTeX `版本号`
* [ ] CTeX
`若需勾选,请把[ ]改成[x]`
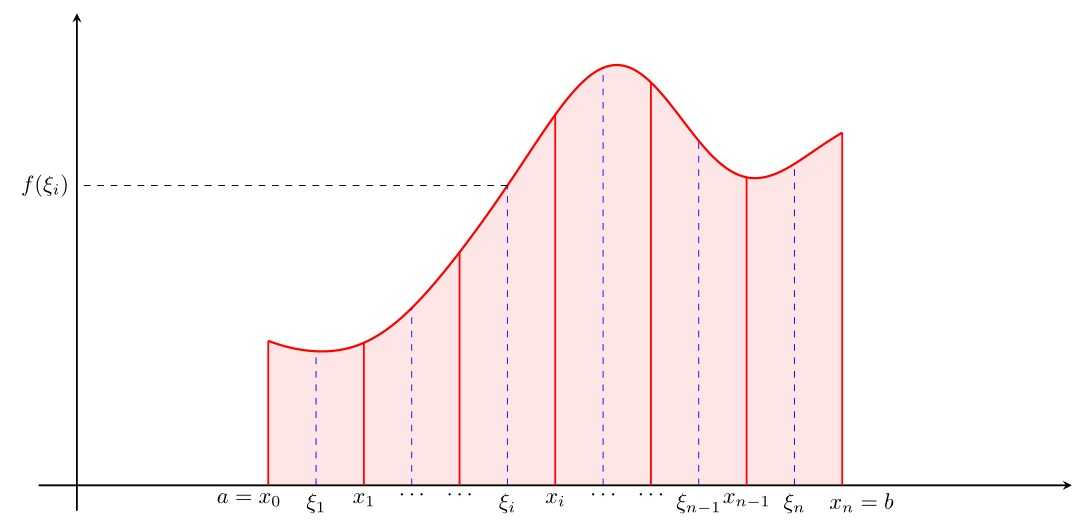
## 我的问题
各位大佬,两个问题
- 可以将横轴tick标记的竖线去掉或者是改为点吗?
- 示意函数值的大小
**感谢**
``\documentclass[border=5mm]{standalone}
\usepackage{pgfplots}
\usetikzlibrary{intersections}
%\usepgfplotslibrary{fillbetween}
\begin{document}
\begin{tikzpicture}[scale=0.9,
declare function={
f(\x)=2+sin(deg(\x-2))+sin(deg(3*\x))/2+sin(deg(5*\x))/8 + sin(deg(7*\x))/28;
}
]
\begin{axis}[
axis lines = middle,
xtick ={.90,1.5,2,2.5,3,3.5,4.1},
ytick ={0},
xticklabels = {$a=x_0$,$x_1$,$\ldots$,$x_i$,$\ldots$ , $x_{n-1}$,$x_n=b$},
ymin = -0.2,
ymax = 3.7,
xmin = -0.2,
xmax = 5.2,
x=3cm,y=2cm,
axis line style = thick,
% xlabel={$x$},
% ylabel={$y$},
extra x ticks={1.25,1.75,2.25,2.75,3.25,3.75},
extra x tick labels={$\xi_1$, $\ldots$, $\xi_i$, $\ldots$, $\xi_{n-1}$, $\xi_n$},
]
\addplot [
domain=1:4,
samples=300,
line width=1pt,
fill=red, draw=none,
fill opacity=0.1
] {f(x)} \closedcycle;
\addplot [
domain=1:4,
samples=300,
line width = 1pt, red] {f(x)};
\addplot [
ycomb, thick, red,
no markers,
samples at={1,1.5,...,4}
] {f(x)};
\addplot [
ycomb, dashed, blue,
no markers,
samples at={1.25,1.75,2.25,2.75,3.25,3.75}
] {f(x)};
\end{axis}
\end{tikzpicture}
\end{document}``

1 回答
0
使用 `tickwidth=0pt` 将 tick 的线宽调整为 0,怎么把 tick 调整成点我不太会。
直接画虚线就可以标记坐标,使用 `clip mode=individual` 避免将 $f(xi_i)$ 裁切掉。
完整代码:
```
\documentclass[border=5mm]{standalone}
\usepackage{pgfplots}
\pgfplotsset{compat=1.17}
\usetikzlibrary{intersections}
%\usepgfplotslibrary{fillbetween}
\begin{document}
\begin{tikzpicture}[scale=0.9,
declare function={
f(\x)=2+sin(deg(\x-2))+sin(deg(3*\x))/2+sin(deg(5*\x))/8 + sin(deg(7*\x))/28;
}
]
\begin{axis}[
axis lines = middle,
xtick ={.90,1.5,2,2.5,3,3.5,4.1},
ytick ={0},
xticklabels = {$a=x_0$,$x_1$,$\ldots$,$x_i$,$\ldots$ , $x_{n-1}$,$x_n=b$},
ymin = -0.2,
ymax = 3.7,
xmin = -0.2,
xmax = 5.2,
x=3cm,y=2cm,
axis line style = thick,
tickwidth=0pt, % 调整 tick 线宽
clip mode=individual, % 避免裁切 node 文字
% xlabel={$x$},
% ylabel={$y$},
extra x ticks={1.25,1.75,2.25,2.75,3.25,3.75},
extra x tick labels={$\xi_1$, $\ldots$, $\xi_i$, $\ldots$, $\xi_{n-1}$, $\xi_n$},
]
\addplot [
domain=1:4,
samples=300,
line width=1pt,
fill=red, draw=none,
fill opacity=0.1
] {f(x)} \closedcycle;
\addplot [
domain=1:4,
samples=300,
line width = 1pt, red] {f(x)};
\addplot [
ycomb, thick, red,
no markers,
samples at={1,1.5,...,4}
] {f(x)};
\addplot [
ycomb, dashed, blue,
no markers,
samples at={1.25,1.75,2.25,2.75,3.25,3.75}
] {f(x)};
\draw[dashed] (axis cs:2.25,{f(2.25)}) -- (axis cs:0,{f(2.25)}) node[left] {$f(\xi_i)$};
\end{axis}
\end{tikzpicture}
\end{document}
```
效果:

-
https://paste.ubuntu.com/p/XhjTb3q5kY/ 感谢大佬 – 霄核 2020-06-06 12:58 回复
你的回答
请登录后回答
你的回答将会帮助更多人,请务必认真回答问题。