提问于:
浏览数:
3135
\documentclass[border=7mm]{standalone}
\usepackage{tikz}
\usetikzlibrary{math}
\tikzmath{
function f(\x) {
if abs(\x) <= 2 then {
return 1;
} else {
return {2*\x};
};
};
}
\begin{document}
\begin{tikzpicture}
\draw[help lines] (-6.5,-9.5) grid (6.5,9.5);
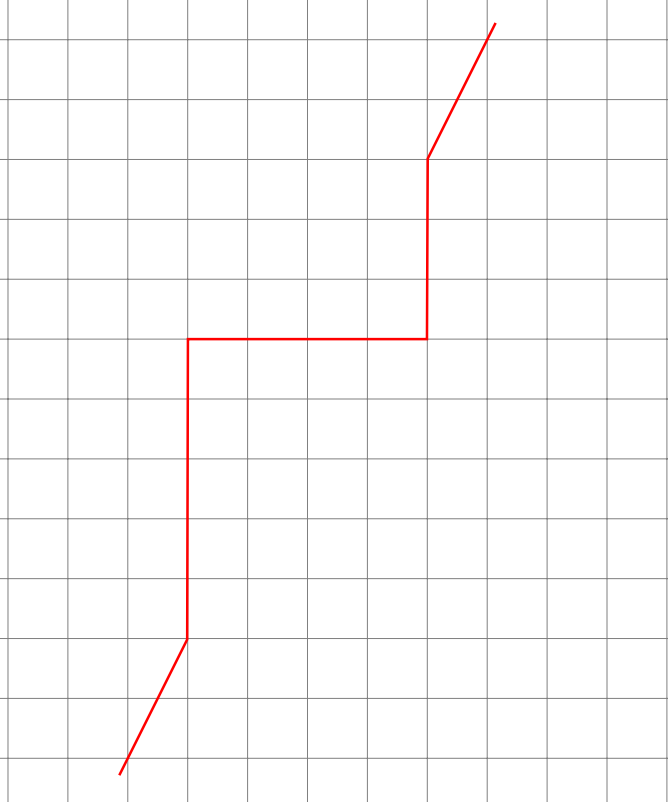
\draw[red, very thick] plot [domain=-pi:pi, samples=500] (\x,{f(\x)});
\end{tikzpicture}
\end{document}
各位大佬,我用这段代码得到的分段函数图像明显错误,不知道什么原因?