提问于:
浏览数:
2649
## 编译环境
操作系统
* [10 ] Windows 7/8/10
* [ ] macOS
* [ ] Linux
`若需勾选,请把[ ]改成[x]`
Tex发行版
* [2020 ] TexLive `年份`
* [ ] MikTeX `版本号`
* [ ] CTeX
`若需勾选,请把[ ]改成[x]`
## 我的问题
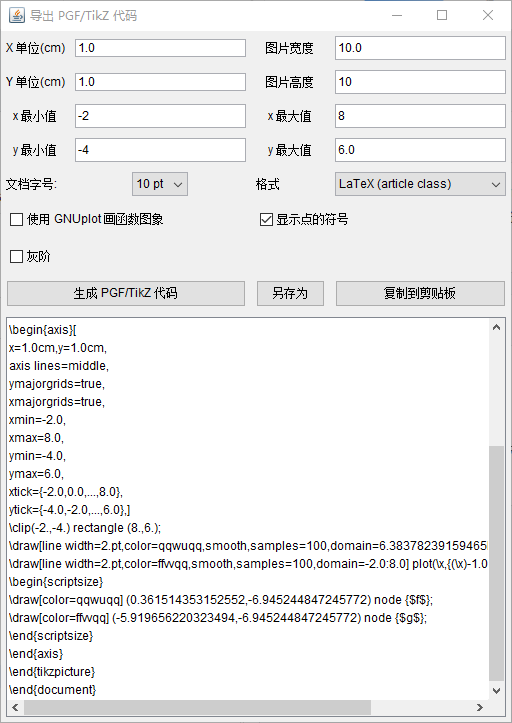
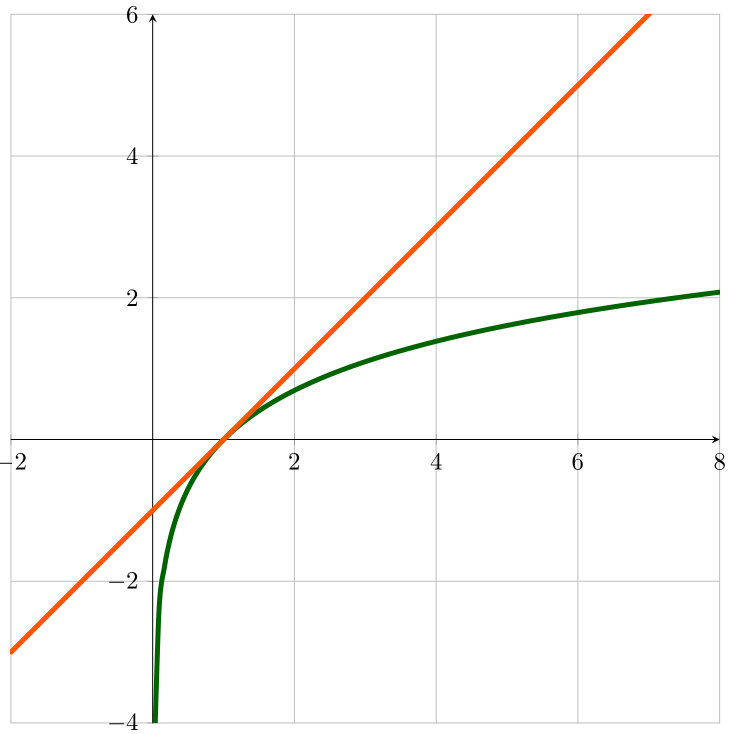
如题,用GeoGebra进行绘图时,生成代码

编译时出现错误
附MWE:
```
\documentclass[10pt]{article}
\usepackage{pgfplots}
\pgfplotsset{compat=1.15}
\usepackage{mathrsfs}
\usetikzlibrary{arrows}
\pagestyle{empty}
\begin{document}
\definecolor{ffvvqq}{rgb}{1.,0.3333333333333333,0.}
\definecolor{qqwuqq}{rgb}{0.,0.39215686274509803,0.}
\begin{tikzpicture}[line cap=round,line join=round,>=triangle 45,x=1.0cm,y=1.0cm]
\begin{axis}[
x=1.0cm,y=1.0cm,
axis lines=middle,
ymajorgrids=true,
xmajorgrids=true,
xmin=-2.0,
xmax=8.0,
ymin=-4.0,
ymax=6.0,
xtick={-2.0,0.0,...,8.0},
ytick={-4.0,-2.0,...,6.0},]
\clip(-2.,-4.) rectangle (8.,6.);
\draw[line width=2.pt,color=qqwuqq,smooth,samples=100,domain=6.38378239159465E-16:8.0] plot(\x,{ln((\x))});
\draw[line width=2.pt,color=ffvvqq,smooth,samples=100,domain=-2.0:8.0] plot(\x,{(\x)-1.0});
\begin{scriptsize}
\draw[color=qqwuqq] (0.361514353152552,-6.945244847245772) node {$f$};
\draw[color=ffvvqq] (-5.919656220323494,-6.945244847245772) node {$g$};
\end{scriptsize}
\end{axis}
\end{tikzpicture}
\end{document}
```
1 回答
8
```latex
\documentclass[10pt]{article}
\usepackage{tikz,pgfplots}
\pgfplotsset{compat=1.15}
\usepackage{mathrsfs}
\usetikzlibrary{arrows}
\pagestyle{empty}
\begin{document}
\definecolor{ffvvqq}{rgb}{1.,0.3333333333333333,0.}
\definecolor{qqwuqq}{rgb}{0.,0.39215686274509803,0.}
\begin{tikzpicture}[line cap=round,line join=round,>=triangle 45,x=1.0cm,y=1.0cm]
\begin{axis}[
x=1.0cm,y=1.0cm,
axis lines=middle,
ymajorgrids=true,
xmajorgrids=true,
xmin=-2.0,
xmax=8.0,
ymin=-4.0,
ymax=6.0,
xtick={-2.0,0.0,...,8.0},
ytick={-4.0,-2.0,...,6.0}]
\clip(-2.,-4.) rectangle (8.,6.);
\draw[line width=2.pt,color=qqwuqq,smooth,samples=100,domain=6.38378239159465E-3:8.0] plot(\x,{ln((\x))});
\draw[line width=2.pt,color=ffvvqq,smooth,samples=100,domain=-2.0:8.0] plot(\x,{(\x)-1.0});
\begin{scriptsize}
\draw[color=qqwuqq] (0.361514353152552,-6.945244847245772) node {$f$};
\draw[color=ffvvqq] (-5.919656220323494,-6.945244847245772) node {$g$};
\end{scriptsize}
\end{axis}
\end{tikzpicture}
\end{document}
```

如果你把 `\begin{axis}[]...\end{axis}` 注释掉就可以看到明显的错误提示:
```latex
! Package PGF Math Error: I cannot calculate the logarithm of `0.0' (in '{ln((0
.0))}').
```
也就是 ln(x) 的起始自变量过小, 把数值调大一些就好了.
**如果在回答中得到了想要的回答, 请点击 `采纳回答` 来把问题归档到 `已解决`**
-
非常感谢! – 玄空出世 2021-02-20 22:44 回复
你的回答
请登录后回答
你的回答将会帮助更多人,请务必认真回答问题。
