提问于:
浏览数:
3380
## 编译环境
操作系统
* [x] Windows 10
* [ ] macOS
* [ ] Linux
`若需勾选,请把[ ]改成[x]`
Tex发行版
* [x] TexLive `2020`
* [ ] MikTeX `版本号`
* [ ] CTeX
`若需勾选,请把[ ]改成[x]`
## 我的问题
*现有一三维函数,难以求解其表达式,但通过一定条件得到了其在某一区域内的一系列坐标取值(直角坐标系)*,于是想通过这些点大致做出该函数的图像。
为了实现此目的,我去tikz宏包手册寻求解决办法,发现对于三维图的绘制,要么直接通过函数表达式绘出,要么是在三维空间中画二维函数图……并没有找到通过已知点大致绘出其三维图的方法。此外对于通过导入数据而直接作图的方法,只找到了一个二维的`plot[⟨local options⟩]file{⟨filename⟩}`语句,但其明确指出只适用于二维,无法读取三个坐标点。于是有了下面的问题,望大佬们帮忙解决一下,非常感谢!
请问latex有没有什么宏包或其他手段通过**导入该组坐标数据(*三维*)**(*由于数据过多,逐个画显然不现实*)而直接做出其三维图形。

2 回答
5
你是要这样的效果吗:
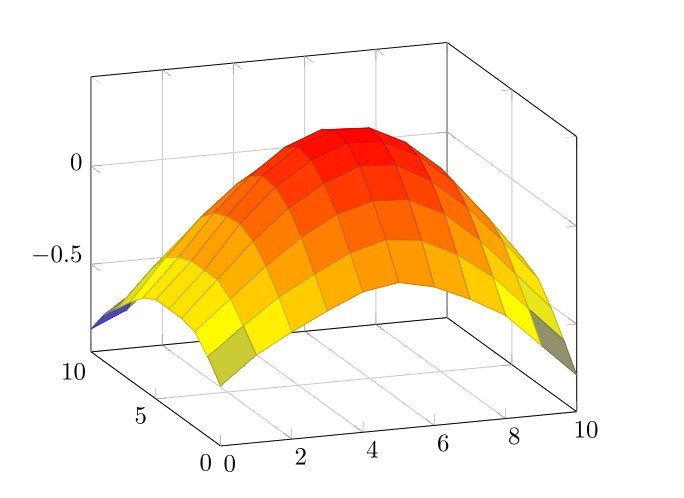
源码:
```
\documentclass{article}
\usepackage{tikz}
\usepackage{pgfplots}
\pgfplotsset{compat=1.7}
\begin{document}
\begin{tikzpicture}
\begin{axis}[view={-20}{20}, grid=both]
\addplot3[surf] file {datafile.txt};
\end{axis}
\end{tikzpicture}
\end{document}
```
数据文件:`datafile.tex`
```
0 0 -0.64
1 0 -0.5
2 0 -0.4
3 0 -0.31
4 0 -0.23
5 0 -0.2
6 0 -0.24
7 0 -0.32
8 0 -0.42
9 0 -0.59
10 0 -0.76
0 1 -0.54
1 1 -0.4
2 1 -0.27
3 1 -0.17
4 1 -0.08
5 1 -0.03
6 1 -0.05
7 1 -0.14
8 1 -0.27
9 1 -0.45
10 1 -0.63
0 2 -0.46
1 2 -0.31
2 2 -0.16
3 2 -0.03
4 2 0.07
5 2 0.12
6 2 0.11
7 2 0.02
8 2 -0.13
9 2 -0.32
10 2 -0.51
0 3 -0.44
1 3 -0.26
2 3 -0.08
3 3 0.07
4 3 0.18
5 3 0.25
6 3 0.24
7 3 0.14
8 3 -0.01
9 3 -0.2
10 3 -0.41
0 4 -0.44
1 4 -0.26
2 4 -0.04
3 4 0.13
4 4 0.25
5 4 0.32
6 4 0.31
7 4 0.22
8 4 0.07
9 4 -0.14
10 4 -0.37
0 5 -0.44
1 5 -0.26
2 5 -0.05
3 5 0.14
4 5 0.27
5 5 0.34
6 5 0.33
7 5 0.24
8 5 0.09
9 5 -0.12
10 5 -0.36
0 6 -0.48
1 6 -0.29
2 6 -0.08
3 6 0.09
4 6 0.22
5 6 0.29
6 6 0.28
7 6 0.2
8 6 0.06
9 6 -0.13
10 6 -0.35
0 7 -0.55
1 7 -0.34
2 7 -0.15
3 7 -0.0
4 7 0.11
5 7 0.18
6 7 0.18
7 7 0.11
8 7 -0.02
9 7 -0.2
10 7 -0.39
0 8 -0.63
1 8 -0.44
2 8 -0.27
3 8 -0.13
4 8 -0.03
5 8 0.04
6 8 0.04
7 8 -0.02
8 8 -0.13
9 8 -0.29
10 8 -0.45
0 9 -0.71
1 9 -0.59
2 9 -0.43
3 9 -0.28
4 9 -0.18
5 9 -0.13
6 9 -0.13
7 9 -0.17
8 9 -0.26
9 9 -0.38
10 9 -0.53
0 10 -0.83
1 10 -0.75
2 10 -0.59
3 10 -0.45
4 10 -0.35
5 10 -0.3
6 10 -0.3
7 10 -0.34
8 10 -0.42
9 10 -0.52
10 10 -0.66
```
来源:[2D surface on a 3D surface plot external data in a file](https://tex.stackexchange.com/questions/103023/2d-surface-on-a-3d-surface-plot-external-data-in-a-file "2D surface on a 3D surface plot external data in a file")

-
– 2021-03-23 10:58 回复
-
对对对,就这种。谢谢大佬!学到了。 – 2020-06-04 19:42 回复
1
导入数据 pgfplots sec 4.3.4 Mathematical Expressions And File Data
坐标设置 pgfplots sec 4.11 3D Axis Configuration

你的回答
请登录后回答
你的回答将会帮助更多人,请务必认真回答问题。