提问于:
浏览数:
2661
## 编译环境
操作系统
* [x] Windows 10
* [ ] macOS
* [ ] Linux
`若需勾选,请把[ ]改成[x]`
Tex发行版
* [x] TexLive `2020`
* [ ] MikTeX `版本号`
* [ ] CTeX
`若需勾选,请把[ ]改成[x]`
## 我的问题
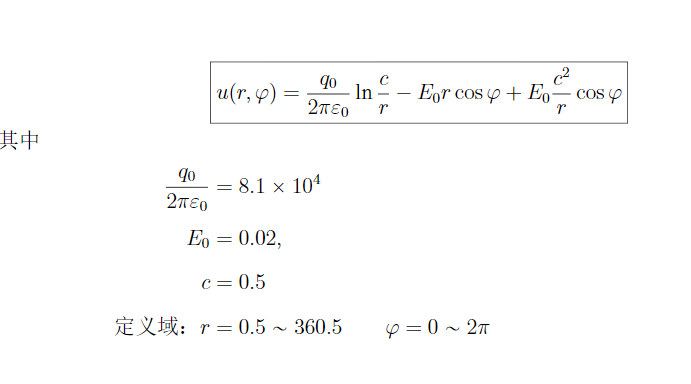
在**柱坐标系下**,已知一函数解析式,请问在LaTeX中如何将其绘出?其函数解析式如下:

1 回答
16
我只会 TikZ 风格的办法。
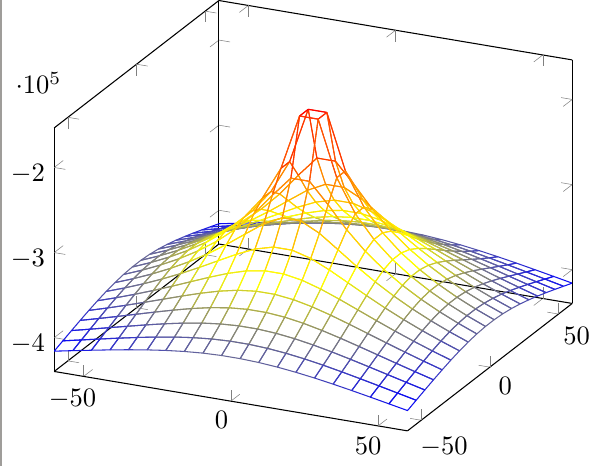
一个办法是用 pgfplots 包:
```
\begin{tikzpicture}
\begin{axis}
\addplot3 [mesh,samples=20,domain=-60:60,miter limit=1]
{81000*ln(0.5/sqrt(x^2+y^2)) - 0.02*x*cos(atan2(y,x)) + 0.02*0.25*cos(atan2(y,x))/sqrt(x^2+y^2)};
\end{axis}
\end{tikzpicture}
```
得到图形
再一个办法是用 plot coordinates 命令,下面的代码需要 fp 包,pgfplotstable 包:
```
%\usepackage{fp}
%\usepackage{pgfplotstable}
%\usetikzlibrary{arrows.meta,3d}
\begin{tikzpicture}[x={(200:0.008cm)},y={(-15:0.008cm)},z={(90:0.05cm)}]
\draw [->](0,0,0)--(400,0,0) node [above] {$x$};
\draw [->](0,0,0)--(0,400,0) node [above] {$y$};
\draw [->](0,0,0)--(0,0,40) node [above] {$z$};
\begin{scope}[line width=0.2pt,]
\foreach \r[count=\s] in {0.5,20.5,...,360.5}% r
{
\foreach \i[count=\j] in {0,10,...,360}% phi
{
\FPdiv\tempA{0.5}{\r}
\FPln\tempA\tempA
\FPmul\tempA{\tempA}{81000}%
\FPmul\tempB{0.02}{\r}
\FPcos\tempC\i
\FPmul\tempB\tempB\tempC%
\FPmul\tempD{0.02}{0.25}
\FPdiv\tempD\tempD{\r}
\FPmul\tempD\tempD\tempC%
\FPsub\tempA\tempA\tempB
\FPadd\tempA\tempA\tempD
\FPdiv\tempA\tempA{10000}
\coordinate (p-\s-\j-p) at (xyz cylindrical cs:radius=\r,angle=\i,z=\tempA);
}
}
\def\tempR{}
\foreach \s in {1,...,19}
{
\pgfplotsforeachungrouped \j in {1,...,37}
{ \edef\tempR{\tempR(p-\s-\j-p)} }
\draw plot[smooth] coordinates{\tempR};
}
\foreach \j in {1,...,37}
{
\pgfplotsforeachungrouped \s in {1,...,19}
{ \edef\tempR{\tempR(p-\s-\j-p)} }
\draw plot[smooth,tension=0.3] coordinates{\tempR};
}
\end{scope}
\end{tikzpicture}
```
经过“一定时间”的等待,得到下图:
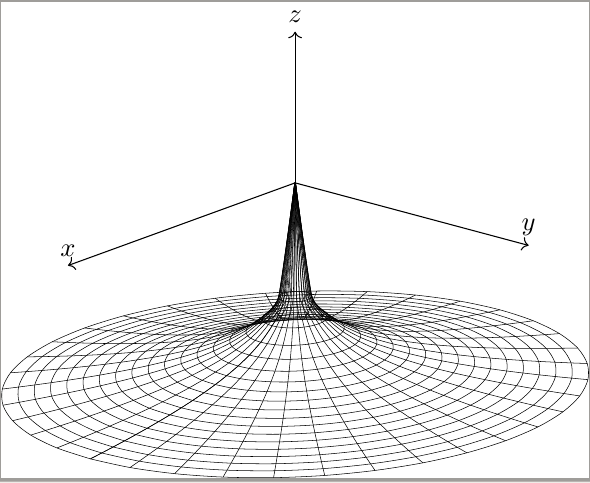
用其他更专业的数学绘图软件可能会得到更好看的图形。
-
非常感谢! – 2020-08-30 19:39 回复
你的回答
请登录后回答
你的回答将会帮助更多人,请务必认真回答问题。