提问于:
浏览数:
2343
## 编译环境
操作系统
Windows 10
Tex发行版
TexLive `2020`
## 我的问题
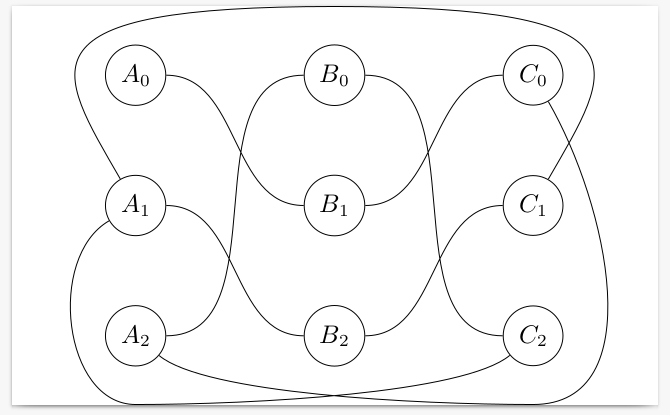
我正在绘制图论里的图,涉及到一些曲线的绘制。
```
\documentclass{article}
\usepackage[utf8]{inputenc}
\usepackage{tikz}
\usetikzlibrary{shapes.geometric, arrows}
\tikzstyle{operator}=[circle, radius= 0.5 cm, text centered, draw=black]
\tikzstyle{operator2}=[circle,fill=black, radius= 0.0 cm]
\tikzstyle{arrow}= [thick, -, >=stealth]
\begin{document}
\begin{tikzpicture}
\node(A0)[operator] {$A_0$};
\node(A1)[operator, below of = A0] {$A_1$};
\node(A2)[operator, below of = A1] {$A_2$};
\node(B0)[operator, right of = A0, xshift=2cm] {$B_0$};
\node(B1)[operator, below of = B0] {$B_1$};
\node(B2)[operator, below of = B1] {$B_2$};
\node(C0)[operator, right of = B0, xshift=2cm] {$C_0$};
\node(C1)[operator, below of = C0] {$C_1$};
\node(C2)[operator, below of = C1] {$C_2$};
\draw (A0) edge[out=0, in=180, arrow] node[pos=0.85, above]{} (B1);
\draw (A1) edge[out=0, in=180, arrow] node[pos=0.85, above]{} (B2);
\draw (A2) edge[out=0, in=180, arrow] node[pos=0.85, above]{} (B0);
\draw (B0) edge[out=0, in=180, arrow] (C2);
\draw (B1) edge[out=0, in=180, arrow] node[pos=0.1, above]{12} (C0);
\draw (B2) edge[out=0, in=180, arrow] node[pos=0.85, above]{} (C1);
\draw (C0) edge[out=-50, in=-20, arrow, out looseness=2.6, in looseness=1.5] node[pos=0.85, below]{} (A2);
\draw (C1) edge[out=40, in=20, arrow, out looseness=1.5] node[pos=0.85, above]{} (A0);
\draw (C2) edge[out=-40, in=-40, arrow, in looseness=1.6] node[pos=0.85, below]{} (A1);
\draw (C1) edge[out=10, in=120, arrow, out looseness=1.5] node[pos=0.85, above]{} (A1);
\end{tikzpicture}
\end{document}
```
得到下面的图
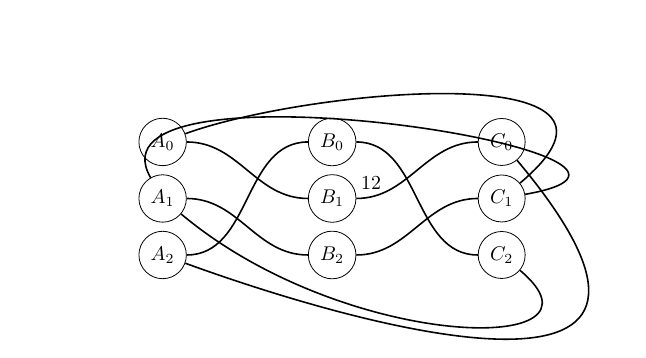
我做了C1A1曲线角度的很多调整,都得不到下面的效果。
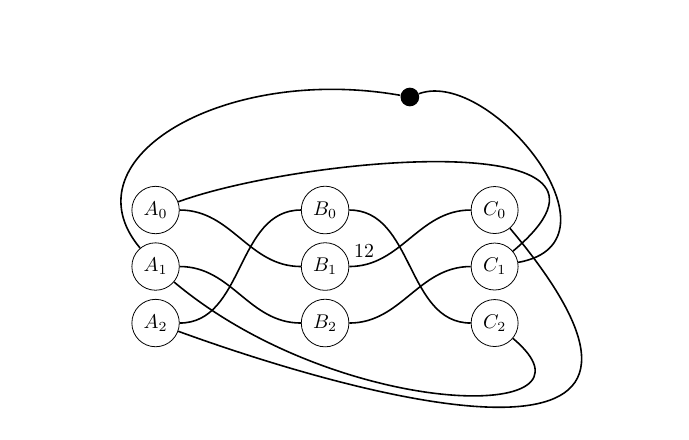
于是我添加一个辅助点D0,让我的曲线更容易绘制,可是又涉及到一个问题,就是辅助点不能很好的缩小,即使设置 radius= 0.0 cm 我不希望显示辅助点
```
\documentclass{article}
\usepackage[utf8]{inputenc}
\usepackage{tikz}
\usetikzlibrary{shapes.geometric, arrows}
\tikzstyle{operator}=[circle, radius= 0.5 cm, text centered, draw=black]
\tikzstyle{operator2}=[circle,fill=black, radius= 0.0 cm]
\tikzstyle{arrow}= [thick, -, >=stealth]
\begin{document}
\begin{tikzpicture}
\node(A0)[operator] {$A_0$};
\node(A1)[operator, below of = A0] {$A_1$};
\node(A2)[operator, below of = A1] {$A_2$};
\node(B0)[operator, right of = A0, xshift=2cm] {$B_0$};
\node(B1)[operator, below of = B0] {$B_1$};
\node(B2)[operator, below of = B1] {$B_2$};
\node(C0)[operator, right of = B0, xshift=2cm] {$C_0$};
\node(C1)[operator, below of = C0] {$C_1$};
\node(C2)[operator, below of = C1] {$C_2$};
\node(D0)[operator2, above of = B0,xshift=1.5cm,yshift=1cm]{}; %辅助点
\draw (A0) edge[out=0, in=180, arrow] node[pos=0.85, above]{} (B1);
\draw (A1) edge[out=0, in=180, arrow] node[pos=0.85, above]{} (B2);
\draw (A2) edge[out=0, in=180, arrow] node[pos=0.85, above]{} (B0);
\draw (B0) edge[out=0, in=180, arrow] (C2);
\draw (B1) edge[out=0, in=180, arrow] node[pos=0.1, above]{12} (C0);
\draw (B2) edge[out=0, in=180, arrow] node[pos=0.85, above]{} (C1);
\draw (C0) edge[out=-50, in=-20, arrow, out looseness=2.6, in looseness=1.5] node[pos=0.85, below]{} (A2);
\draw (C1) edge[out=40, in=20, arrow, out looseness=1.5] node[pos=0.85, above]{} (A0);
\draw (C2) edge[out=-40, in=-40, arrow, in looseness=1.6] node[pos=0.85, below]{} (A1);
%C1到A0借助辅助点D0
\draw (C1) edge[out=10, in=20, arrow, out looseness=1.5] node[pos=0.85, above]{} (D0);%
\draw (D0) edge[out=170, in=130, arrow, out looseness=1.5] node[pos=0.85, above]{} (A1);
\end{tikzpicture}
\end{document}
```
我应该怎么得到我想要的 C1A1曲线。谢谢大家!
2 回答
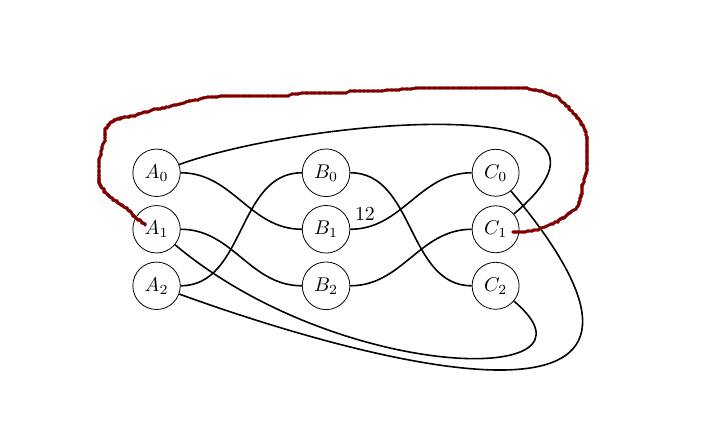
1
但凡带点不规则曲线的,没有图形化工具直接用 tikz 敲都很难受的啊
```tex
\documentclass{article}
\usepackage[utf8]{inputenc}
\usepackage{tikz}
\usetikzlibrary{shapes.geometric, arrows}
\tikzstyle{operator}=[circle, radius= 0.5 cm, text centered, draw=black]
\tikzstyle{operator2}=[circle,fill=black, radius= 0.0 cm]
\tikzstyle{arrow}= [thick, -, >=stealth]
\begin{document}
\begin{tikzpicture}
\node(A0)[operator] {$A_0$};
\node(A1)[operator, below of = A0] {$A_1$};
\node(A2)[operator, below of = A1] {$A_2$};
\node(B0)[operator, right of = A0, xshift=2cm] {$B_0$};
\node(B1)[operator, below of = B0] {$B_1$};
\node(B2)[operator, below of = B1] {$B_2$};
\node(C0)[operator, right of = B0, xshift=2cm] {$C_0$};
\node(C1)[operator, below of = C0] {$C_1$};
\node(C2)[operator, below of = C1] {$C_2$};
\draw (A0) edge[out=0, in=180, arrow] node[pos=0.85, above]{} (B1);
\draw (A1) edge[out=0, in=180, arrow] node[pos=0.85, above]{} (B2);
\draw (A2) edge[out=0, in=180, arrow] node[pos=0.85, above]{} (B0);
\draw (B0) edge[out=0, in=180, arrow] (C2);
\draw (B1) edge[out=0, in=180, arrow] node[pos=0.1, above]{12} (C0);
\draw (B2) edge[out=0, in=180, arrow] node[pos=0.85, above]{} (C1);
\draw (C0) edge[out=-50, in=-20, arrow, out looseness=2.6, in looseness=1.5] node[pos=0.85, below]{} (A2);
\draw (C1) edge[out=40, in=20, arrow, out looseness=1.5] node[pos=0.85, above]{} (A0);
\draw (C2) edge[out=-40, in=-40, arrow, in looseness=1.6] node[pos=0.85, below]{} (A1);
\draw[arrow] plot[smooth, tension=.7] coordinates {(A1.west) (-0.9614,0.5872) (3.0698,1.3528) (7.0596,1.0583) (7.9136,-0.1342) (C1.east)};
\end{tikzpicture}
\end{document}
```
作者追问:2020-11-25 19:15
十分感谢的您帮助! tikz学习成本挺高的,不过我准备选择它的原因是清晰的向量图格式。

-
非常感谢! – 当我走在曲线上 2020-11-25 19:17 回复
-
谢谢你的回答,的确如此,tikz如果绘制图论的直边会比较方便,绘制这类比较头疼。我一般采用smartdraw或者几何画板画一些 – 当我走在曲线上 2020-11-25 19:13 回复
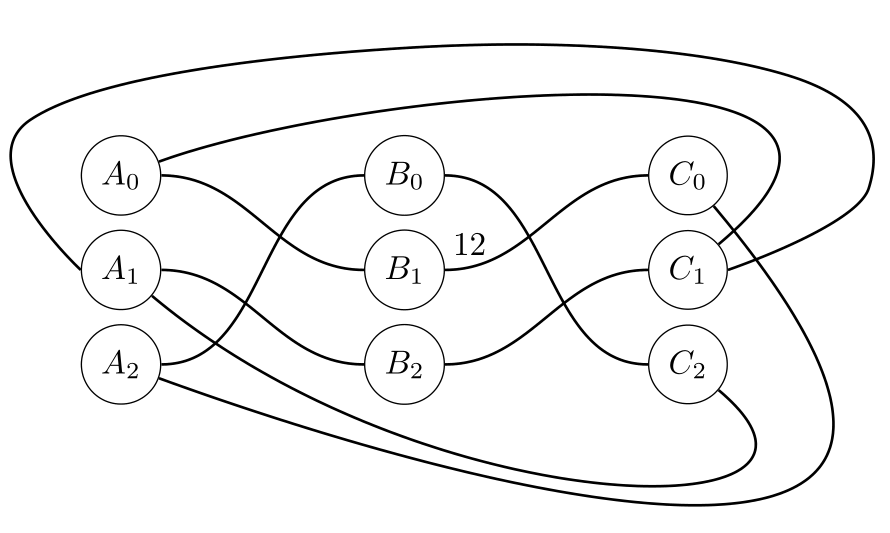
1
```c
\begin{tikzpicture}
\matrix(m)[matrix of math nodes,nodes={circle,draw},column sep=2cm,row sep=1cm]
{
A_0 & B_0 & C_0 \\
A_1 & B_1 & C_1 \\
A_2 & B_2 & C_2 \\
};
\coordinate(a1)at($(m-3-1)+(0,-1)$);
\coordinate(a2)at($(m-3-3)+(0,-1)$);
\coordinate(a3)at($(m-1-2)+(0,1)$);
\draw (m-1-1) to[out=0,in=180] (m-2-2)
to[out=0,in=180] (m-1-3)
to[out=-60,in=0] (a2)
to[out=180,in=-40,out looseness=.8,in looseness=.4] (m-3-1)
to[out=0,in=180] (m-1-2)
to[out=0,in=180] (m-3-3)
to[out=220,in=0,out looseness=.4,in looseness=.8](a1)
to[out=180,in=210](m-2-1)
to[out=0,in=180] (m-3-2)
to[out=0,in=180] (m-2-3)
to[out=60,in=0,out looseness=1.2,in looseness=3] (a3)
to[out=180,in=120,out looseness=3,in looseness=1.2] (m-2-1);
\end{tikzpicture}
```
效果是
你使用了
```c
\node(D0)[operator2, above of = B0,xshift=1.5cm,yshift=1cm]{}; %辅助点
```
这个命令,node 默认的`/tikz/inner xsep`和`/tikz/inner ysep`是`.3333em`,所以画出来的点是有尺寸的。
你的回答
请登录后回答
你的回答将会帮助更多人,请务必认真回答问题。