我准备用tikz画这样的一个图
图中`A`和`B`区域打算用不同的...
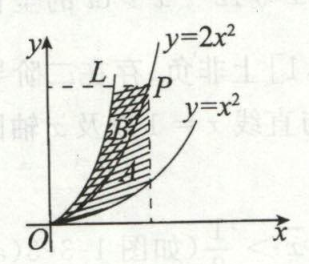
我准备用tikz画这样的一个图

图中`A`和`B`区域打算用不同的颜色区分,可是该如何用`\fill`(或其他命令)命令实现呢?
目前能做到的代码如下
```tex
\documentclass[UTF8]{standalone}
\usepackage{amsmath,fourier,ctex,tikz}
\begin{document}
\begin{tikzpicture}[domain=-0.3:3]
\draw[-latex] (-0.3,0) node[left=-3pt,below=-2pt] {$O$} -- (2,0) node[below] {$x$};
\draw[-latex] (0,-0.3) -- (0,2) node[left] {$y$};
\draw[domain=0:1.2] plot (\x,{0.5*\x^2}) node[right] {$y = x^{2}$};
\draw[domain=0:0.9] plot (\x,{2*\x^2}) node[right] {$y = 2x^{2}$};
\draw[domain=0:0.62] plot (\x,{3.5*\x^2}) node[above] {$L$};
\draw[dashed] (0.8,2*0.8^2) -- (0,2*0.8^2);
\draw[dashed] (0.8,2*0.8^2) -- (0.8,0);
\fill[domain=0:0.8,fill=gray] (0,0) plot (\x,{0.5*\x^2}) -- (0.8,2*0.8^2) plot (\x,{2*\x^2});
\end{tikzpicture}
\end{document}
```
不知道怎么才能将`y = 2x^{2}`设置为阴影的边界
{var%20f='http://v.t.sina.com.cn/share/share.php?appkey=1515056452',u=z||d.location,p=['&url=',e(u),'&title=',e(t||d.title),'&source=',e(r),'&sourceUrl=',e(l),'&content=',c||'gb2312','&pic=',e(p||'')].join('');function%20a(){if(!window.open([f,p].join(''),'mb',['toolbar=0,status=0,resizable=1,width=440,height=430,left=',(s.width-440)/2,',top=',(s.height-430)/2].join('')))u.href=[f,p].join('');};if(/Firefox/.test(navigator.userAgent))setTimeout(a,0);else%20a();})(screen,document,encodeURIComponent,'','','https://wenda.latexstudio.net/data/attach/logo/logo.png', '推荐 sikouhjw 的问题《如何用tikz填充不规则图形的颜色》','https://wenda.latexstudio.net/answer/1341/1868.html','页面编码gb2312|utf-8默认gb2312'));)
一周热门 更多>