提问于:
浏览数:
8138
我准备用tikz画这样的一个图
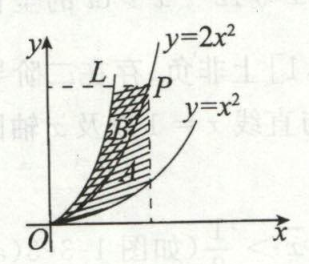
图中`A`和`B`区域打算用不同的颜色区分,可是该如何用`\fill`(或其他命令)命令实现呢?
目前能做到的代码如下
```tex
\documentclass[UTF8]{standalone}
\usepackage{amsmath,fourier,ctex,tikz}
\begin{document}
\begin{tikzpicture}[domain=-0.3:3]
\draw[-latex] (-0.3,0) node[left=-3pt,below=-2pt] {$O$} -- (2,0) node[below] {$x$};
\draw[-latex] (0,-0.3) -- (0,2) node[left] {$y$};
\draw[domain=0:1.2] plot (\x,{0.5*\x^2}) node[right] {$y = x^{2}$};
\draw[domain=0:0.9] plot (\x,{2*\x^2}) node[right] {$y = 2x^{2}$};
\draw[domain=0:0.62] plot (\x,{3.5*\x^2}) node[above] {$L$};
\draw[dashed] (0.8,2*0.8^2) -- (0,2*0.8^2);
\draw[dashed] (0.8,2*0.8^2) -- (0.8,0);
\fill[domain=0:0.8,fill=gray] (0,0) plot (\x,{0.5*\x^2}) -- (0.8,2*0.8^2) plot (\x,{2*\x^2});
\end{tikzpicture}
\end{document}
```
不知道怎么才能将`y = 2x^{2}`设置为阴影的边界

3 回答
1
方法不太好, 但是能出来结果
```tex
\documentclass{standalone}
\usepackage{tikz}
\usetikzlibrary{math}
\begin{document}
\begin{tikzpicture}
\draw [<->] (2,0) -| (0,3);
\fill [fill = lightgray] [domain = 0:1,smooth] plot (\x, {pow(\x,2)}) -- (1,2) [domain = 1:0, smooth] -- plot (\x, {2*pow(\x,2)}) -- cycle;
\fill [fill = gray] [domain = 0:1,smooth] plot (\x, {2*pow(\x,2)}) -- (0.5,2) [domain = 0.5:0, smooth] -- plot (\x, {8*pow(\x,2)}) -- cycle;
\end{tikzpicture}
\end{document}
```
-
谢谢! – sikouhjw 2019-11-03 08:59 回复
-
回复 咸菜的味道 :的确, 刚测试了一下, 问题完美解决, 谢谢! – 枝下珂 2019-11-01 14:14 回复
-
在命令中的第二个 plot 前面加 -- 再试试。试试 \path [fill = red] (0,3)--(1,4)-- cycle; \path [fill = red] (0,0) --(0.8 – 咸菜的味道 2019-10-31 22:25 回复
1
使用pgfplots宏包的fillbetween库也许是一个办法。
一个来自[https://tex.stackexchange.com/questions/367668/strange-fill-between-behavior](https://tex.stackexchange.com/questions/367668/strange-fill-between-behavior "https://tex.stackexchange.com/questions/367668/strange-fill-between-behavior")的例子如下:
```tex
\documentclass{standalone}
\usepackage{tikz,pgfplots}
\usepgfplotslibrary{fillbetween}
\pgfplotsset{compat=1.3}
\begin{document}
\begin{tikzpicture}
\begin{axis}[
xmin=-2,xmax=2,
ymin=0,ymax=4,
height = 6cm,
minor tick num=1,
axis lines=center,
axis line style=<->
]
\addplot[name path=G,green,domain={-2:2}] {x^2};
\addplot[name path=F,blue,domain={-2:2}] {-x^2+2};
% \addplot[color=blue!50]fill between[of=G and F, split, clip={domain=-1:1}];
\tikzfillbetween [of=F and G,split,every even segment/.style={white!1}] {red!50};
\end{axis}
\end{tikzpicture}
\end{document}
```
另一个来自[https://tex.stackexchange.com/questions/7914/fill-between-two-curves-in-pgfplots](https://tex.stackexchange.com/questions/7914/fill-between-two-curves-in-pgfplots "https://tex.stackexchange.com/questions/7914/fill-between-two-curves-in-pgfplots")的例子为:
```tex
\documentclass{standalone}
\usepackage{pgfplots}
\pgfplotsset{compat=1.10}
\usepgfplotslibrary{fillbetween}
\begin{document}
\begin{tikzpicture}
\begin{axis}
\addplot[name path=A,blue,mark=*,line width=2pt] table {
0 2
0.5 -1
1 3
};
\addplot[name path=B,orange,mark=*,line width=2pt] coordinates {(0,0) (1,1)};
\addplot[gray!40] fill between[of=A and B];
\end{axis}
\end{tikzpicture}
\end{document}
```
可以将函数改为需要的函数,希望对解决问题有用。
可在命令行使用`texdoc pgfplots`查看其使用说明。
1
一则过度定制的例子
```tex
\documentclass{article}
\usepackage{tikz}
\usetikzlibrary{patterns.meta}
% derived from `texdoc tikz`, sec. 62.3
\tikzdeclarepattern{%
name=lines,
parameters={
\pgfkeysvalueof{/pgf/pattern keys/size},
\pgfkeysvalueof{/pgf/pattern keys/angle},
\pgfkeysvalueof{/pgf/pattern keys/line width},
\pgfkeysvalueof{/pgf/pattern keys/color},
},
bounding box={(-.1pt,-.1pt) and
(\pgfkeysvalueof{/pgf/pattern keys/size}+.1pt,
\pgfkeysvalueof{/pgf/pattern keys/size}+.1pt)},
tile size={(\pgfkeysvalueof{/pgf/pattern keys/size},
\pgfkeysvalueof{/pgf/pattern keys/size})},
tile transformation={rotate=\pgfkeysvalueof{/pgf/pattern keys/angle}},
defaults={
size/.initial=5pt,
angle/.initial=0,
line width/.initial=.2pt,
color/.initial=gray,
},
code={
\draw[line width=\pgfkeysvalueof{/pgf/pattern keys/line width},
color=\pgfkeysvalueof{/pgf/pattern keys/color}]
(0,0) -- (\pgfkeysvalueof{/pgf/pattern keys/size},
\pgfkeysvalueof{/pgf/pattern keys/size});
}
}
\begin{document}
\tikzset{
tag label/.style={
above right, font=\small, inner sep=2pt
}
}
% shorthands: sqr - square, R - reversed
\begin{tikzpicture}[scale=2, samples=500]
\draw[help lines] (0, 0) grid (2, 2);
% slanted lines
\fill[pattern={lines[angle=160]}]
plot[id=squ, domain=0:1] function{x*x} -- (1, 2)
-- (0.5, 2) --
plot[id=8squR, domain=.5:0] function{8*x*x} -- cycle;
\fill[pattern={lines[angle=180]}]
plot[id=2squ, domain=0:1] function{2*x*x} -- (0.5, 2) --
plot[id=8squR, domain=.5:0] function{8*x*x} -- cycle;
% plots and labels
\draw plot[id=squ, domain=0:1]
function{x*x} node[tag label] {$x^2$};
\draw plot[id=2squ, domain=0:1]
function{2*x*x} node[tag label] {$2x^2$};
\draw plot[id=8squ, domain=0:.5]
function{8*x*x} node[tag label, above] {$8x^2$};
\end{tikzpicture}
\end{document}
```
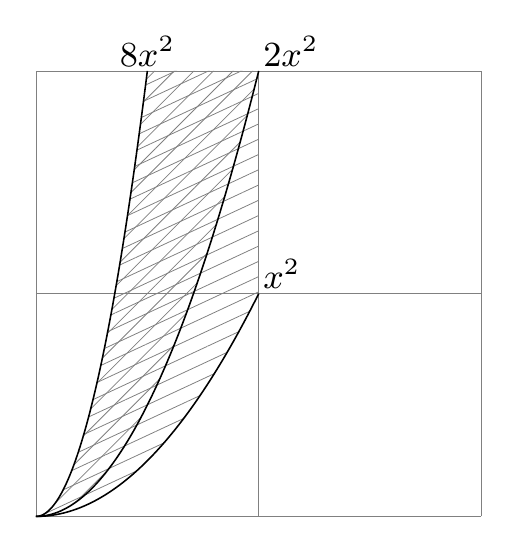
1. 因为用了 `plot function{...}` 的语法,需要使用 `-shell-escape` 选项并安装 gnuplot 绘图程序。调用 gnuplot 旨在减少坐标重复计算、加快编译速度,用 `plot (<x>, <y>)` 的语法也完全可以。
1. 只要是封闭图形就能 `\fill`,需要注意 `--plot` 和 `plot` 的不同,详见 `texdoc tikz`, sec. 22.2。
1. 提供这个回答只是说明「能画」,个人强烈建议用所见即所得的绘图工具作图。
你的回答
请登录后回答
你的回答将会帮助更多人,请务必认真回答问题。